CtrA-bistable switch mechanism
The core of the model is conjectured as a CtrA master-regulator switch that drives the cell division cycle in Caulobacter (Fig 2) (Brazhnik and Tyson, 2006).
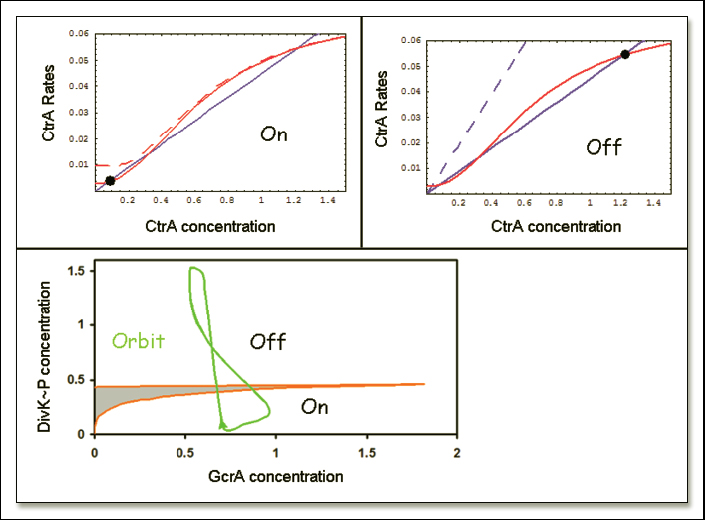
Figure 2. Master-regulator switch and corresponding bifurcation diagram for the Caulobacter model.
The core of the model is a master-regulator 'switch' controlling the level of CtrA protein. During the stalked-cell cycle, CtrA alternates between a state of low concentration (at the beginning of the cycle) and a state of high concentration (just before division). These two states can be thought of as quasi-steady states of CtrA abundance, where the rate of production of CtrA is balanced by its rate of degradation. In Fig 2A we plot the rates of production and degradation of CtrA (as predicted by the model) as functions of CtrA concentration, for specific values of the concentrations of GcrA and DivK~P. The points of intersection of these two curves correspond to quasi-steady-state concentrations of CtrA (i.e., steady states of [CtrA] as long as [GcrA] and [DivK~P] are kept fixed). Note that the CtrA production curve is sigmoidal because of the regulatory properties of the two ctrA promoters. Under the conditions in Fig 2A ([GcrA] and [DivK~P] both small), the sigmoidal production curve intersects the linear degradation curve in three places, creating two stable steady-state concentrations of CtrA separated by an unstable steady state. At the beginning of the stalked-cell cycle, [CtrA] is small, and we may think of the control system as caught in the lower stable steady state (Fig. 2A, black button). To enter the cell cycle, [GcrA] must increase to promote DNA replication, which ultimately drives CtrA to the upper steady state. In Fig 2A, the lower steady state is lost at [GcrA] ~ 0.7, and [CtrA] must then switch over to the upper steady state. As [CtrA] rises, GcrA production is turned off and [GcrA] drops. The control system is now caught in the upper steady state in Fig 2B. To complete the cycle, CtrA must be pushed back to the lower steady state, which is accomplished by increasing [DivK~P], as in Fig 2B. At [DivK~P] ~ 0.4 the upper steady state is lost and [CtrA] must switch to the lower steady state.
It should be clear from Fig 2A and B that the number of stable steady states of CtrA depends simultaneously on the concentrations of GcrA and DivK~P. The dependence is captured in Fig 2C, where we plot a wedge-shaped region in the [GcrA],[DivK~P] plane. Inside the wedge, CtrA exhibits three steady state values (two stable, one unstable). Outside the wedge, there is a unique CtrA steady state (low [CtrA] above the wedge and high [CtrA] below the wedge). As a simulated stalked cell proceeds through the cell division cycle, it crosses back and forth across the wedge, switching first from low-to-high [CtrA] to initiate the division process, and then from high-to-low [CtrA] when the Z-ring closes at the end of the cycle. This progression of events is illustrated by the green line in Fig 2C, which is a parametric plot of [GcrA](t) and [DivK~P](t) as time proceeds in the simulation. Fig 2C suggests a molecular interpretation of the numerical simulation. Start at the arrow, with [CtrA] high, [GcrA] low and [DivK~P] low. CtrA promotes closing of the Z-ring, which causes DivK to be phosphorylated in the stalked compartment. Increasing [DivK~P] pushes the CtrA switch to the 'low' position. As a result, [GcrA] now increases and DivK is steadily dephosphorylated in the young stalked cell. The increase of [GcrA] and decrease of [DivK~P] drives the CtrA control system across the wedge of bistability and eventually brings CtrA back to the high steady state. [GcrA] drops and the cell cycle trajectory returns to the arrow, where we started.
See more details in the paper:
Brazhnik P and Tyson JJ.(2006). Cell cycle control in bacteria and yeast: a case of convergent evolution? Cell Cycle. 5(5):522-9
 webmaster